Call us on: +254701315228
Turning Raw Data into Actionable Insights: The 2026 Guide for Business Leaders
Most companies collect data but struggle to extract value. Unprocessed datasets hide patterns like seasonal sales dips or customer churn risks, leading to guesswork decisions.
Raw data floods modern businesses sales logs, customer interactions, website metrics—but sits unused in spreadsheets. Turning it into actionable insights unlocks 20-30% profit gains through smarter decisions, as data-driven firms consistently outperform peers.
This detailed guide breaks down the process for premium clients seeking data analytics services. Master these steps to spot trends, cut waste, and scale operations in 2026’s competitive landscape.
Why Raw Data Alone Fails Businesses
Most companies collect data but struggle to extract value. Unprocessed datasets hide patterns like seasonal sales dips or customer churn risks, leading to guesswork decisions.
Without structure, 80% of data becomes “dark”—inaccessible for analysis. Premium analytics transforms this chaos into clear strategies, such as reallocating budgets from underperforming channels.
Step 1: Collect and Clean Your Raw Data
Start with quality inputs. Pull data from CRMs (e.g., HubSpot), Google Analytics, or ERP systems into a central warehouse like Snowflake.
Cleaning removes noise:
- Duplicates and blanks: Use Excel’s “Remove Duplicates” or Python’s Pandas dropna().
- Outliers: Flag anomalies via z-scores (e.g., sales >3 standard deviations).
- Standardize formats: Convert dates to YYYY-MM-DD; unify currencies.
A Nairobi retailer cleaned transaction logs, revealing 15% revenue leakage from unrecorded refunds.
Step 2: Define KPIs Aligned to Business Goals
Not all metrics matter. Focus on 5-7 KPIs tied to objectives, like Customer Lifetime Value (CLV) for retention or CAC:LTV ratio for growth.
| Goal | Key KPI | Formula Example |
|---|---|---|
| Revenue Growth | Monthly Recurring Revenue | Sum of subscriptions |
| Efficiency | Sales Velocity | (Wins × Avg Price) / Sales Cycle |
| Retention | Churn Rate | (Lost Customers / Total) × 100 |
Track weekly via dashboards to pivot fast—e.g., if churn exceeds 5%, investigate service gaps.
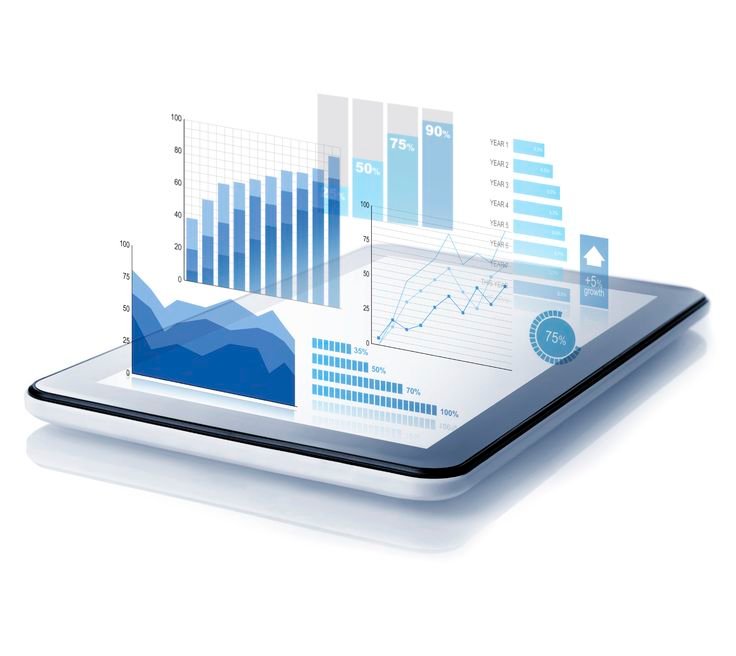
Step 3: Analyze with Visualization Tools
Raw numbers confuse; visuals reveal stories. Use Power BI for interactive dashboards or Tableau for trend mapping.
Process:
- Exploratory Data Analysis (EDA): Plot histograms for distributions; heatmaps for correlations.
- Segmentation: Group customers by RFM (Recency, Frequency, Monetary) to target high-value segments.
- Trend forecasting: Apply moving averages or ARIMA for predictions.
Example: A Kenyan SaaS firm visualized funnel drop-offs, boosting conversions 25% by simplifying checkout.
Step 4: Leverage AI for Deeper Insights
In 2026, AI automates discovery. Tools like ChatGPT for SQL queries or AutoML platforms uncover non-obvious patterns, such as sentiment-driven churn.
From conversation history, integrate GenAI with RAG for real-time queries on sales data. This shifts analysis from manual to predictive, spotting opportunities like upsell triggers.
Step 5: Turn Insights into Actionable Decisions
Insights without action waste time. Use a decision framework:
- Prioritize: Score by impact (revenue potential) and effort (implementation time).
- Test: A/B experiments validate findings—e.g., email timing from engagement data.
- Automate: Set alerts for KPI thresholds (e.g., Slack notifications for traffic drops).
- Iterate: Review quarterly, refining models with new data.
Case: Logistics client used insights to optimize routes, saving 18% on fuel costs.
Common Pitfalls and How to Avoid Them
- Siloed data: Centralize with ETL pipelines (e.g., Airflow).
- Overloading dashboards: Limit to 4-6 visuals per page.
- Ignoring context: Blend quantitative data with qualitative feedback.
- No ownership: Assign KPI stewards per department.
Businesses skipping these lose 2-3x growth potential to analytics-savvy rivals.
Tools Stack for 2026 Success
Build your pipeline:

- Free starters: Google Sheets, BigQuery sandbox.
- Mid-tier: Power BI Desktop, Looker Studio.
- Enterprise: Databricks for AI, dbt for transformations.
Freelance data analysts deliver custom setups, scaling from Excel prototypes to full BI solutions.
Ready to transform your raw data into revenue-driving insights? Our data analytics services build tailored dashboards and BI solutions for premium clients.